The Essential Guide to Linux System Monitoring with Top, Htop, and Vmstat
Introduction
When it comes to running Linux servers and applications, monitoring system performance is crucial to ensuring everything is running smoothly. In this guide, we will provide an overview of three powerful command-line utilities that can help you monitor system performance: top, htop, and vmstat.
1- Getting Started with top
top is a simple and powerful tool that provides a real-time, dynamic view of the processes running on your Linux system. Here’s how you can get started with top:
- Install top: Top is usually included with most Linux distributions. If it’s not installed on your system, you can install it using the package manager of your distribution. For example, on Ubuntu and Debian, you can install top with the command
sudo apt-get install procps. - Launch top: To launch top, simply open a terminal window and type
top. - Understanding the output: Top provides a lot of information, including CPU usage, memory usage, and process information. The default output shows the processes with the highest CPU usage at the top of the list. You can use the arrow keys to move up and down the list, and the
qkey to quit top.
2- Getting Started with htop
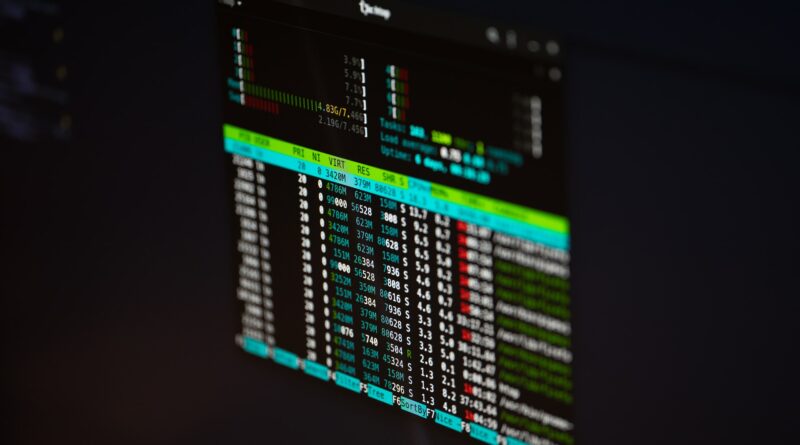
htop is an improved version of top that provides a more user-friendly interface and additional features. Here’s how you can get started with htop:
- Install htop: Htop is not usually installed by default on most Linux distributions. You can install it using the package manager of your distribution. For example, on Ubuntu and Debian, you can install htop with the command
sudo apt-get install htop. - Launch htop: To launch htop, simply open a terminal window and type
htop. - Understanding the output: Htop provides a similar set of information as top, but with a more user-friendly interface. You can use the arrow keys to move up and down the list, and the
qkey to quit htop.
3- Getting Started with vmstat
vmstat is a tool that provides information on the usage of system resources, including CPU, memory, and I/O. Here’s how you can get started with vmstat:
- Install vmstat: Vmstat is usually included with most Linux distributions. If it’s not installed on your system, you can install it using the package manager of your distribution. For example, on Ubuntu and Debian, you can install vmstat with the command
sudo apt-get install procps. - Launch vmstat: To launch vmstat, simply open a terminal window and type
vmstat. - Understanding the output: Vmstat provides a lot of information, including CPU usage, memory usage, and I/O usage. The default output shows a summary of system activity since boot, as well as a real-time view of system activity. You can use the
qkey to quit vmstat.
4- Advanced Usage of top, htop, and vmstat
While top, htop, and vmstat provide a wealth of information on system performance out of the box, they also offer advanced options for more detailed analysis. Here are some examples of advanced usage:
- Filtering: You can filter top and htop to show specific processes or system resources. For example, to show only the processes owned by a specific user, you can use the following command:
top -U username
Similarly, to show only the processes using a certain amount of CPU, you can use the following command:
top -o %CPU
- Sorting: You can sort the output of top and htop based on various criteria such as CPU usage, memory usage, and process ID. To sort top by CPU usage, you can press the “P” key. To sort htop by memory usage, you can press the “F6” key and select the “MEM%” option.
- Color-coded output: htop provides color-coded output to help you identify the processes that are consuming the most system resources. By default, processes using more than 75% of CPU or memory are displayed in red. You can adjust these values by pressing the “F2” key and selecting the “Display options” menu.
- Continuous monitoring: vmstat can be used for continuous monitoring of system performance. You can use the “-n” option to set the interval between updates. For example, to monitor system performance every 5 seconds, you can use the following command:
vmstat -n 5
- Redirecting output: You can redirect the output of top, htop, and vmstat to a file or another command for further analysis. For example, to save the output of top to a file, you can use the following command:
top -n 1 > top_output.txt
This command saves the output of top to a file called “top_output.txt”. Similarly, to pipe the output of vmstat to another command, you can use the following command:
vmstat 1 | awk '{print $1}'
This command pipes the output of vmstat to the awk command, which prints the first column of data (the timestamp) on each line.
With these advanced options, you can gain deeper insights into system performance and troubleshoot issues more effectively.
5- Conclusion
In conclusion, top, htop, and vmstat are powerful command-line utilities for monitoring system performance in Linux. With these tools, you can gain valuable insights into CPU, memory, and I/O usage on your system, and troubleshoot issues more effectively.
While top and htop provide real-time information on system performance, vmstat offers a more detailed view of system resource usage over time. By combining these tools and their advanced options, you can get a comprehensive view of your system’s performance.
In addition, the ability to filter, sort, and color-code output allows you to quickly identify processes that are consuming the most resources and take action accordingly. And with the ability to redirect output to a file or another command, you can perform further analysis on system performance data.
By mastering these tools and incorporating them into your Linux administration toolkit, you can optimize system performance and ensure that your applications are running smoothly. Whether you’re a system administrator or a developer, knowledge of these tools is essential for maintaining the health and performance of your Linux systems.
We hope this guide has provided you with a useful overview of top, htop, and vmstat, and their advanced usage. If you have any questions or comments, please feel free to leave them in the comments section below. Thank you for reading!


